5 Best Filter Nonwoven Fabric Manufacturers Worldwide
Choosing the right Filter Nonwoven Fabric manufacturer can shape product performance, production stability, and long-term operating costs. This guide examines five respected manufacturers serving international markets. It focuses on practical evidence, not impressive claims alone.
The evaluation considers fiber selection, filtration efficiency, air permeability, tensile strength, and manufacturing consistency. It also reviews clean production areas, laboratory testing, quality certificates, and technical support. A reliable supplier should explain how polypropylene, polyester, or composite layers suit specific filtration tasks. Samples matter. A fabric roll may look uniform under warehouse lighting, yet reveal weak bonding or uneven thickness during testing.
Factory experience shows that specifications rarely tell the entire story. Shipment control, response speed, and batch traceability can become decisive after purchase. Some manufacturers offer strong customization, while others provide better consistency through standardized products. Neither approach is automatically superior. The best choice depends on filter design, operating temperature, moisture exposure, and expected service life.
This comparison is useful, but it is not perfect. Public information can omit recent equipment changes or regional production differences. Buyers should verify current test reports and request production samples before signing a major contract. Small details count. A clear technical discussion often reveals more than a polished brochure. These five manufacturers provide a practical starting point for engineers, distributors, and procurement teams seeking dependable Filter Nonwoven Fabric worldwide.
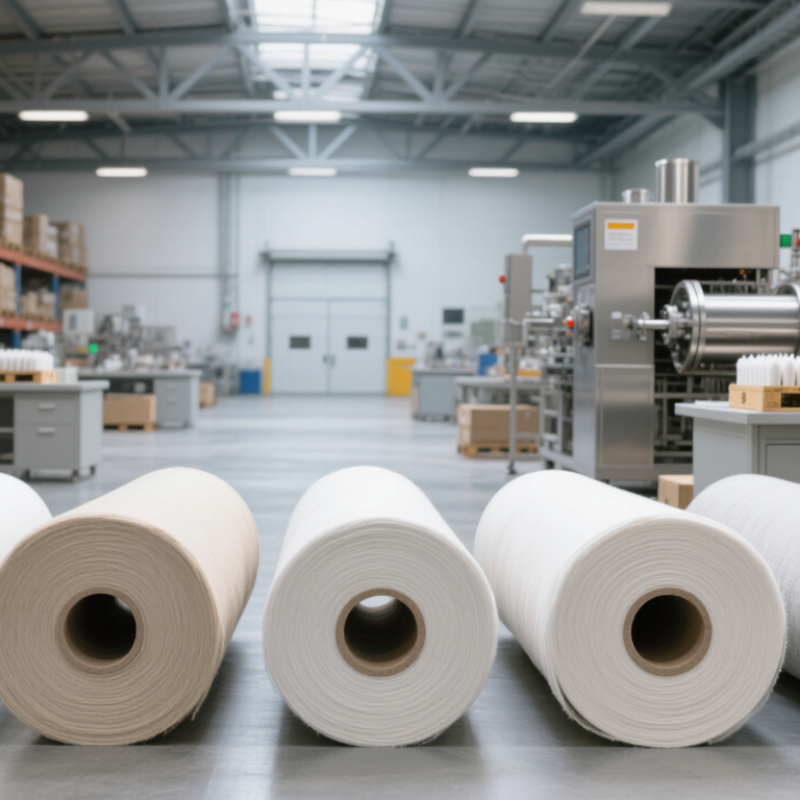
Filter Nonwoven Fabric: Types, Standards, and Global Applications
Filter nonwoven fabric is engineered for separation, protection, and controlled airflow. Its structure determines performance. Spunbond layers provide strength, while meltblown webs capture fine particles through dense microfibers. Needle-punched fabrics suit dust collection and industrial filtration because they tolerate repeated handling. Wet-laid and electrospun media offer finer control, but they may need stronger support layers. No single type fits every system.
Standards help buyers compare performance more reliably. Air filters may follow ISO 16890, which evaluates particulate removal across defined particle-size ranges. Respiratory products can require EN 143 or EN 149 testing, depending on design and use. Water and liquid filters often rely on application-specific pressure, retention, and chemical-resistance tests. Test results should include airflow, pressure drop, filtration efficiency, and service life. A high capture rate means little if the filter blocks too quickly.
Global applications include ventilation units, vehicle cabins, clean manufacturing areas, drinking-water treatment, and protective workwear. In a factory, a pleated nonwoven cartridge may reduce dust while maintaining steady airflow. In a hospital environment, low-lint media and controlled production conditions matter greatly. Humidity, oil mist, temperature, and cleaning methods can change performance. Supplier audits, traceability records, and batch testing strengthen reliability. Still, laboratory data cannot fully predict field behavior. Real installations sometimes reveal unexpected loading patterns. That gap deserves careful review.
Ranking Criteria: Efficiency, Pressure Drop, ISO 16890, and Capacity
5 Best Filter Nonwoven Fabric Manufacturers Worldwide
Choosing the five best filter nonwoven fabric manufacturers requires more than comparing brochures. I rank suppliers by efficiency, pressure drop, ISO 16890 testing, and production capacity. These criteria reflect real purchasing conditions, not only laboratory promises. A fabric may capture fine particles effectively, yet create excessive resistance in an operating air-handling unit. That increases fan energy and can shorten maintenance intervals.
Efficiency must be checked across the intended particle range. Ask for independent test data, not isolated internal figures. ISO 16890 classification, including ePM1, ePM2.5, and ePM10 performance, provides a useful comparison framework. Still, test conditions matter. Airflow, humidity, dust type, and loading time can change results. Pressure drop should be recorded at several face velocities, preferably with clear graphs and repeatable methods.
Capacity is equally practical. I examine monthly output, roll widths, minimum order quantities, lead times, and backup production lines. Consistent basis weight and fiber distribution often matter more than impressive peak capacity. During factory evaluations, I would inspect quality records and sample rolls, especially edges and splice areas. Small defects become costly in automated filter assembly. No ranking is perfect. Supplier data may be incomplete, and field performance can differ from controlled testing. Buyers should validate samples under their own airflow, dust load, and conversion process before signing long-term agreements.
5 Best Filter Nonwoven Fabric Manufacturers Worldwide — Ranking Criteria: Efficiency, Pressure Drop, ISO 16890, and Capacity
Evidence-based ranking framework. No manufacturer-specific test results or production figures are provided, so this table does not claim a verified ranking of individual manufacturers.
| Ranking criterion | What to compare | Evidence-based assessment | How it should affect a ranking |
| 1. Filtration efficiency | Fractional particle-removal performance across the intended particle-size range, measured on the finished filter medium or filter element. | Compare results from the same test method and at the same face velocity. Efficiency depends on the material construction and test conditions; a single percentage without those details is not a like-for-like comparison. | Give greater weight to independently tested results that match the intended application and include test conditions. |
| 2. Pressure drop | Initial resistance to airflow at a stated face velocity, plus any change in resistance during the specified test or service interval. | Pressure drop is operating-condition dependent. ISO 16890 includes methods for determining airflow resistance, but it does not set one universal acceptable pressure-drop value for every application. | Compare only values measured at equivalent airflow and sample conditions; assess pressure drop alongside efficiency. |
| 3. ISO 16890 classification | Declared ISO 16890 group and ePM fraction, supported by test documentation for the relevant product. | ISO 16890 classifies general-ventilation air filters using particle-size efficiency testing. Its ePM categories include ePM1, ePM2.5, and ePM10; the standard does not rank manufacturers. | Prefer current, traceable reports identifying the tested product and method. Do not treat an ISO class as proof of performance outside its stated scope. |
| 4. Production capacity | Verified output for the relevant nonwoven type, usable production width, lead time, and ability to maintain supply at the required specification. | Capacity is specific to a manufacturer, product, and time period; it is not established by ISO 16890. Compare documented figures using consistent units and product scope. | Score capacity against the buyer’s required volume and delivery schedule, rather than assuming that larger stated output always means better performance. |
| 5. Quality consistency and traceability | Repeatability between production lots, documented quality controls, and traceable test reports for the supplied material. | Assess quality-system documentation and lot-level records separately from filter-performance classification. A certificate alone does not establish the performance of every product or batch. | Give preference to suppliers able to provide current, product-specific data and consistent records for delivered lots. |
Berry Global and Johns Manville: Capacity, Certifications, and Market Reach
For two large multinational filter-media producers, capacity is more than a headline figure. Buyers should compare usable output by process, material, and plant—not total corporate tonnage. A meltblown line, for example, is not interchangeable with a glass-fiber line when a project specifies pressure drop, efficiency, or operating temperature. EDANA’s 2022 statistics put Greater Europe’s total nonwoven production at about 2.884 million tonnes. That figure covers many end uses, not filtration alone, so it provides market context rather than a measure of either supplier’s filter capacity.
That distinction matters.
Certification claims need the same care. ISO 9001 and ISO 14001 indicate management systems, but do not certify a filter’s performance. Request current certificates for the manufacturing site, plus test data for the exact grade and configuration. EN 1822 testing can help assess high-efficiency filters; it does not replace application-specific validation.
One uncomfortable gap: public materials rarely make plant-level filter capacity easy to compare. Ask about backup lines, lead times, and regional inventory. A broad sales network helps, but it cannot fix a specification mismatch. Verify it with samples.
Hollingsworth & Vose: Specialty Media and HEPA Efficiency of ≥99.97%
Specialty nonwoven filter media must balance capture efficiency, airflow, strength, and service life. For HEPA classification, the U.S. Environmental Protection Agency’s 2021 Guide to Air Cleaners identifies 99.97% removal at the 0.3-micron test particle. That figure matters. However, real performance depends on pleat design, gasket compression, and installation quality. A perfect media sheet cannot repair a leaking frame.
Reliable manufacturers typically combine fine fibers with controlled basis weight and graded structures. ISO 29463 and ASHRAE Standard 52.2 provide recognized methods for evaluating high-efficiency filtration and particle removal. In production trials, pressure drop should be measured before and after dust loading. Energy use can rise as resistance increases. The filter may still pass its efficiency test, yet perform poorly in a neglected housing. This is an uncomfortable detail, but it deserves attention.
Tips
Ask for efficiency curves, pressure-drop data, test conditions, and lot traceability. Check results at 0.3 microns, not only average particle sizes. Review the sealing system too. One weak corner can defeat strong media. Avoid choosing by efficiency alone; lifecycle cost and replacement intervals often reveal the better option. Some specifications remain incomplete, and that should trigger questions rather than confidence.
